Data & Performance
Performance Analysis 2021
Our Science-based targets performance
In 2017, we were one of more than 1,000 companies in the Science Based Targets initiative (SBTi) – a global partnership enabling businesses to set ambitious GHG emissions reduction targets in line with the latest climate science, and in 2019 had our targets validated.
Our targets state we need to reduce our Scope 1 and 2 GHG emissions by 55% by 2027. In 2021, we continued to make progress towards achieving this longer term target. To align with our net zero strategy, we are now looking to update our target to be consistent with the 1.5°C maximum temperature rise scenario, which will allow us to set new reduction milestones. We look forward to presenting these in our future reporting.
We have reduced our carbon by 55% against our 2013 baseline.
Refer to the Data section for our Carbon intensity reductions chart here.
We have reduced our energy intensity by 28% against our 2013 baseline.
Refer to the Data section for our Energy intensity reductions chart here.
SBT carbon intensity
reductions
We have reduced our carbon by 55% against our 2013 baseline.

Base data methodology
Our reporting period is aligned to our financial year, which is set to the calendar year – 1 January to 31 December 2021.
For 2021 our reporting scope covers the following portfolios:
Managed portfolio
Number of properties: 44
Area: 395,740 m2
Like-for-like portfolio
Number of properties: 32
Area: 313,211 m2
For context this is our total portfolio:
*Total portfolio
Number of properties: 77
Area: 517,826 m2
*Single-let portfolio
Number of properties: 33
Area: 179,280 m2
*This is from our net lettable area only.
We measure and report electricity, gas and water consumption and waste generated from our managed and like-for-like portfolios. We do not report data from single-let properties as we have no management control or influence over these.
Reporting boundaries
This means our reporting is on the following basis:
Managed portfolio includes:
- Electricity - Landlord common areas consumption and occupier consumption
- Water - Whole building consumption
- Gas & biomass - Whole building consumption
- Waste - Properties under the Derwent London waste management contract
Managed portfolio excludes:
Electricity, water and gas & biomass:
- Retail and residential consumption
- Refurbishment/development projects
- Single-let properties with no management control and access to utilities data.
Data is collected on a monthly basis and consolidated for each managed property. Manual meter readings taken by our building management teams are used as the primary source for our reporting, and validated against automatic (AMR) readings and utility invoices.
Managed portfolio methodology
We report consumption from areas controlled by the landlord (common areas). To establish these areas, we deduct the net lettable floor area (NLA) from the gross internal area (GIA) for each property. Where the GIA figure is unknown, we take the gross external area (GEA) from our fire insurance valuations and reduce this by 2% in line with standard industry practice. To calculate the common area usage, we divide total building consumption by the total building area, and then multiply the figure by the total common area. We also report our occupiers’ consumption by deducting the common area use from the total building use. This approach does result in a minor misalignment in our landlord energy and landlord carbon intensity calculations because gas and water use a denominator of floor area based on GIA, whereas electricity uses common areas only. To balance this misalignment, we include figures for common areas (landlord usage) and total building (landlord and occupier usage).
Recycling and general waste figures are provided for properties where we have waste management control. We exclude retail, residential and development waste from our total figures due to our having no management control or influence over these waste streams. All waste is either recycled or sent to a waste-to-energy plant, with none sent to landfill.
Like-for-like methodology
Our like-for-like portfolio includes properties that have been within the portfolio for the entirety of the current and prior reporting year. Each year we will restate the prior year’s data to align with the updated like-for-like portfolio.
Carbon methodology
We report our emissions in line with the Greenhouse Gas (GHG) Protocol Corporate Accounting and Reporting Standard with emissions reported under the following categories:
Scope 1 – Direct emissions
Scope 2 – Indirect emissions (location and market based)
Scope 3 – Other indirect emissions
Scope 1 fugitive emissions are calculated by using equipment service records that state the amount of refrigerant recharge (top-ups). Those figures are included in our managed portfolio carbon intensity emissions. This year, we have reported zero emissions.
A distance calculator (www.mapcrow.info) is used to calculate air travel emissions, which incorporates DEFRA carbon conversion factors for air travel. Radiative forcing is also considered when calculating air travel emissions.
Different carbon conversion factors were applied to each car according to its type e.g. luxury, 4×4 etc. and fuel type. To calculate the financial intensities, we use a total turnover figure and fair market value figure. The turnover figure stated in the 2021 Report and Accounts is £178,433,073. Likewise, the fair market value figure was stated at £5,696,717,000. During 2021 we have secured green (renewable) gas contracts for 13 properties (which is reflected in our Scope 1 reporting). 99.4% of our purchased electricity supplies are REGO-backed.
Carbon conversion factors
Every year, Defra releases a new set of conversion factors for greenhouse gas reporting (Greenhouse gas reporting: conversion factors 2021). We apply this carbon conversion factor to report our greenhouse gas emissions.
See our Environmental and Health & Safety assurance statement here
Where data has been independently assured by Deloitte LLP, this is referenced with an (A)
Assurance statements
Environmental and Health & safety assurance statement
Independent assurance statement by Deloitte LLP to Derwent London plc on key environmental and health and safety indicators included within the Responsibility Report 2021 (“the Report”)
Use of Report
This report is made solely to the Directors of Derwent London plc in accordance with our agreed terms of engagement. Without assuming or accepting any responsibility or liability in respect of this report to any party other than Derwent London plc and the Directors of Derwent London plc, we acknowledge that the Directors of Derwent London plc may choose to make this report publicly available for others wishing to have access to it, which does not and will not affect or extend for any purpose or on any basis our responsibilities.
What we looked at: scope of our work
Derwent London plc engaged us to perform reasonable assurance procedures for the year ended 31 December 2021 on the following subject matters:
Performance metrics:
- Scope 1 and Scope 2 (location-based) greenhouse gas emissions per square metre across managed portfolio (tCO₂e/m2)
- Scope 1 and Scope 2 (location-based) greenhouse gas emissions per square metre across like-for-like managed portfolio (tCO₂e/m2)
- Scope 1 and Scope 2 (location-based) greenhouse gas emissions across managed portfolio (tCO₂e)
- Scope 1 and Scope 2 (location-based) greenhouse gas emissions across like-for-like managed portfolio (tCO₂e)
- Scope 2 (market-based) greenhouse gas emissions across managed portfolio (tCO₂e)
- Scope 2 (market-based) greenhouse gas emissions across like-for-like managed portfolio (tCO₂e)
- Scope 2 (market-based) greenhouse gas emissions per square metre across managed portfolio (tCO₂e/m2)
- Scope 2 (market-based) greenhouse gas emissions per square metre across like-for-like managed portfolio (tCO₂e/m2)
- Scope 3 greenhouse gas emissions of the organisation across managed portfolio (tCO₂e)
- Scope 3 greenhouse gas emissions of the organisation across like-for-like portfolio (tCO₂e)
- Total water use per square metre across managed portfolio (m3/m2)
- Total water use per square metre across like-for-like managed portfolio (m3/m2)
- Total water use across managed portfolio (m3)
- Total water use across like-for-like managed portfolio (m3)
- Electricity per square metre across managed portfolio (kWh/m2)
- Electricity per square metre across like-for-like managed portfolio (kWh/m2)
- Electricity use across managed portfolio (kWh)
- Electricity use across like-for-like managed portfolio (kWh)
- Gas use per square metre across managed portfolio (kWh/m2)
- Gas use per square metre across like-for-like managed portfolio (kWh/m2)
- Gas use across managed portfolio (kWh)
- Gas use across like-for-like managed portfolio (kWh)
- Waste to landfill across managed portfolio (tonnes)
- Waste to landfill across like-for-like managed portfolio (tonnes)
- Recycling rate across managed portfolio (%)
- Recycling rate across like-for-like managed portfolio (%)
- Percentage of embodied carbon covered by offsetting practices for developments (%)
- Percentage of electricity emissions covered by REGO certification for the managed portfolio (%)
- Scope 3 intensity indicator – downstream leased assets on a per m2 basis
- Injury rate across employees, managed properties and construction properties
- Severity rate across construction properties
- Lost date rate across construction properties
- RIDDOR accident frequency rate across employees, managed properties and construction properties
- Fatalities across employees, managed properties and construction properties
- RIDDORs across employees, managed properties and construction properties
- Dangerous occurrences across employees, managed properties and construction properties
- Minor accidents across employees, managed properties and construction properties
- HSE Improvement notices across employees, managed properties and construction properties
- HSE Prohibition notices across employees, managed properties and construction properties
- Person hours worked across employees, managed properties and construction properties
Progress against targets (2021 performance against 2013 baseline):
- % reduction in carbon emissions intensity of 36% by 2022 and 55% by 2027
- % reduction in energy intensity across managed like-for-like portfolio of 9% by 2022 and 16% by 2027
What we found: our unqualified assurance opinion
Based on the scope of our work and the assurance procedures we performed we conclude that
the selected key performance data and the progress against selected targets described above, are in all material respects, fairly stated in accordance with the applicable criteria.
What standards we used: basis of our work and level of assurance
We carried out reasonable assurance on the selected key performance indicators specified above in accordance with the International Standard on Assurance Engagements 3000 (Revised) (ISAE 3000 (Revised)). To achieve assurance, ISAE 3000 (Revised) requires that we review the processes, systems and competencies used to compile the areas on which we provide assurance. Considering the risk of material error, we planned and performed our work to obtain the information and explanations we considered necessary to provide sufficient evidence to support our assurance conclusion. The evaluation criteria used for our assurance are the definitions as described by Derwent London plc which can be found on the Derwent London website.
Inherent limitations
The process an organisation adopts to define, gather and report data on its non-financial performance is not subject to the formal processes adopted for financial reporting. Therefore, data of this nature can be subject to variations in definitions, collection and reporting methodology with no consistent, accepted standard. This may result in non-comparable information between organisations and from year to year within an organisation as methodologies develop. To support clarity in this process, Derwent London publishes the methodologies used to prepare the reported information (“the reporting criteria”). We have carried out our assurance against this criteria and it should be read together with this report. Please note that assessment of the methodology behind the embodied carbon of the managed portfolio is not within the scope of our assurance or reporting.
What we did: our key environmental assurance procedures
Our work was planned to mirror Derwent London plc’s own group level compilation processes, tracing how data for each indicator within our assurance scope was collected, collated and validated by corporate head office and included in the Report. Our work did not include undertaking controls testing of the third party systems involved in Derwent London’s data collection processes.
To form our conclusions, our environmental procedures comprised:
- interviewing management at the Company’s head office, including the Sustainability team and those with operational responsibility for performance in the areas we are reporting on;
- interviewing staff at Derwent London’s energy and environmental consultants, Briar Associates, with responsibility for collection and assurance of data in the areas we are reporting on;
- conducting site visits for a sample of 10 sites, comprised of nine managed sites and one construction site, and interviewed key stakeholders at the waste management and business recycling company, Paper Round, to understand and review data collection processes and to verify the accuracy of source evidence collected onsite;
- reviewing and evaluating the criteria for measurement and reporting of each indicator as set out in the Basis of Reporting;
- reviewing and evaluating the criteria for the measurement of, and reporting of progress against, performance against the targets selected by the Company;
- understanding, analysing and testing on a sample basis the key structures, systems, processes, procedures and controls relating to the aggregation, validation and reporting of the environmental performance data set out above; and
- reviewing the content of the Report against the findings of our work and making recommendations for improvement where necessary.
What we did: our key health and safety assurance procedures
To form our conclusions, our key health and safety procedures comprised:
- interviewing management at the Company’s head office, including the health and safety team and those with operational responsibility for health and safety performance. This included interviewing onsite health and safety leads and a selection of employees at a sample of live construction sites and managed sites (see below);
- conducting site visits for a sample of 10 sites, comprised of nine managed sites and one construction site to understand and review data collection processes and to verify the accuracy of source evidence collected onsite;
- reviewing and evaluating the criteria for measurement and reporting of each indicator as set out in the Basis of Reporting;
- understanding, analysing and testing on a sample basis the key structures, systems, processes, procedures and controls relating to the aggregation, validation and reporting of the health and safety performance data set out above; and
- reviewing the content of the Reports against the findings of our work and making recommendations for improvement where necessary.
Responsibilities of directors and independent assurance provider Derwent London plc’s responsibilities
The Directors are responsible for the preparation of the Report and for the information and statements contained within it. They are responsible for determining the sustainability objectives and for establishing and maintaining appropriate performance management and internal control systems from which the reported information is derived.
Deloitte’s responsibilities
We complied with Deloitte’s independence policies, which address and, in certain cases, exceed the requirements of the International Federation of Accountants Code of Ethics for Professional Accountants in their role as independent auditors and in particular preclude us from taking financial, commercial, governance and ownership positions which might affect, or be perceived to affect, our independence and impartiality and from any involvement in the preparation of the Report. The firm applies the International Standard on Quality Control 1 and accordingly maintains a comprehensive system of quality control including documented policies and procedures regarding compliance with ethical requirements, professional standards and applicable legal and regulatory requirements.
We have confirmed to Derwent London plc that we have maintained our independence and objectivity throughout the year and in particular that there were no events or prohibited services provided which could impair our independence and objectivity. Our team consisted of a combination of sustainability and assurance professionals with environmental and health & safety expertise, including many years’ experience in providing sustainability report assurance.
Our responsibility is to independently express a conclusion on the Report as defined within the scope of work above to Derwent London plc in accordance with our letter of engagement. Our work has been undertaken so that we might state to Derwent London plc those matters we are required to state to them in this statement and for no other purpose. To the fullest extent permitted by law, we do not accept or assume responsibility to anyone other than Derwent London plc for our work, for this statement, or for the conclusions we have formed.
Deloitte LLP
London, United Kingdom 11 February 2022
Carbon
Intensity metrics (managed portfolio Scope 1 & 2) (A)
Intensity metrics (like-for-like portfolio Scope 1 & 2) (A)
Managed landlord and tenant emissions tCO₂e (A)
- Scope 1
- Scope 2
- Scope 3
- Gas (total building)
- Fuel use in Derwent London company cars for business travel
- Electricity use - generation (landlord-controlled areas and Derwent London occupied floor area)
- Electricity use - WTT Generated Scope 3 Indirect GHG (total building)
- Electricity use - T&D Direct & WTT T&D Indirect (total building)
- Gas (total building)
- Downstream leased assets (tenant electricity emissions)
- Water use (total building)
- Waste (total building)
Like-for-like landlord and tenant emissions tCO₂e (A)
- Scope 1
- Scope 2
- Scope 3
- Gas (total building)
- Electricity use - generation (total building)
- Electricity use - WTT Generated Scope 3 Indirect GHG (total building)
- Electricity use - T&D Direct & WTT T&D Indirect (total building)
- Gas (total building)
- Downstream leased assets (tenant electricity emissions)
- Water use (total building)
- Waste (total building)
Landlord emissions (A)
Like-for-like landlord emissions (A)
Like-for-like landlord emissions (A)-HQ
Scope 3 emissions (A)
Embodied carbon intensity

SBT Carbon intensity reductions
- Carbon Intensity
- UK MARKAL
- Derwent London Emissions
SBT Scope 3 intensity emissions

Embodied carbon emissions (A)
Carbon conversion factor table - 2021
Energy
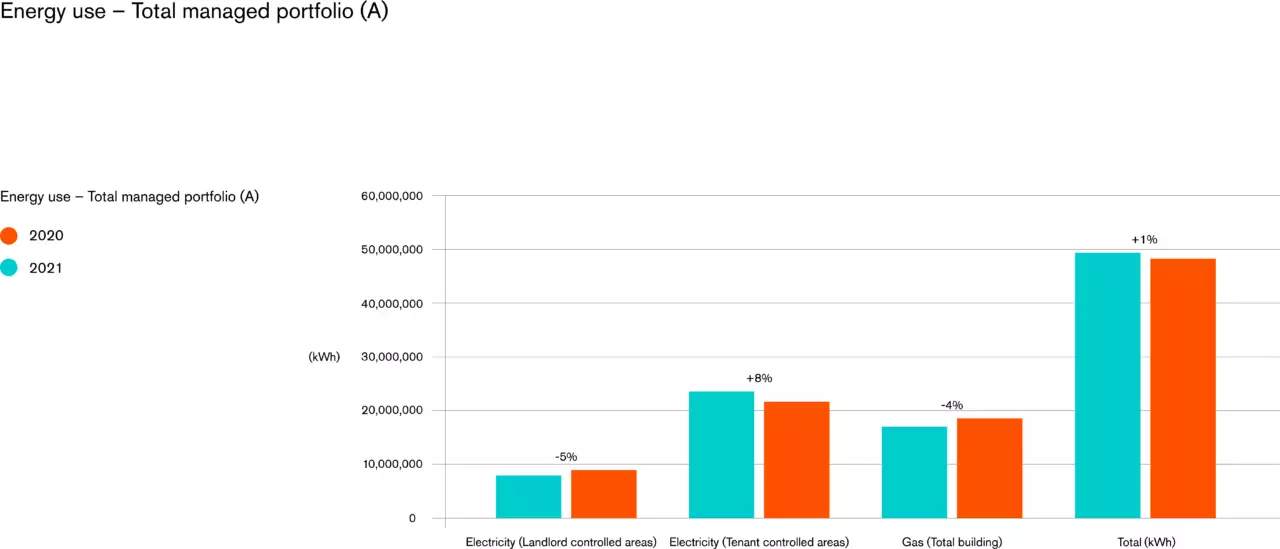
Energy use - total managed portfolio (A)
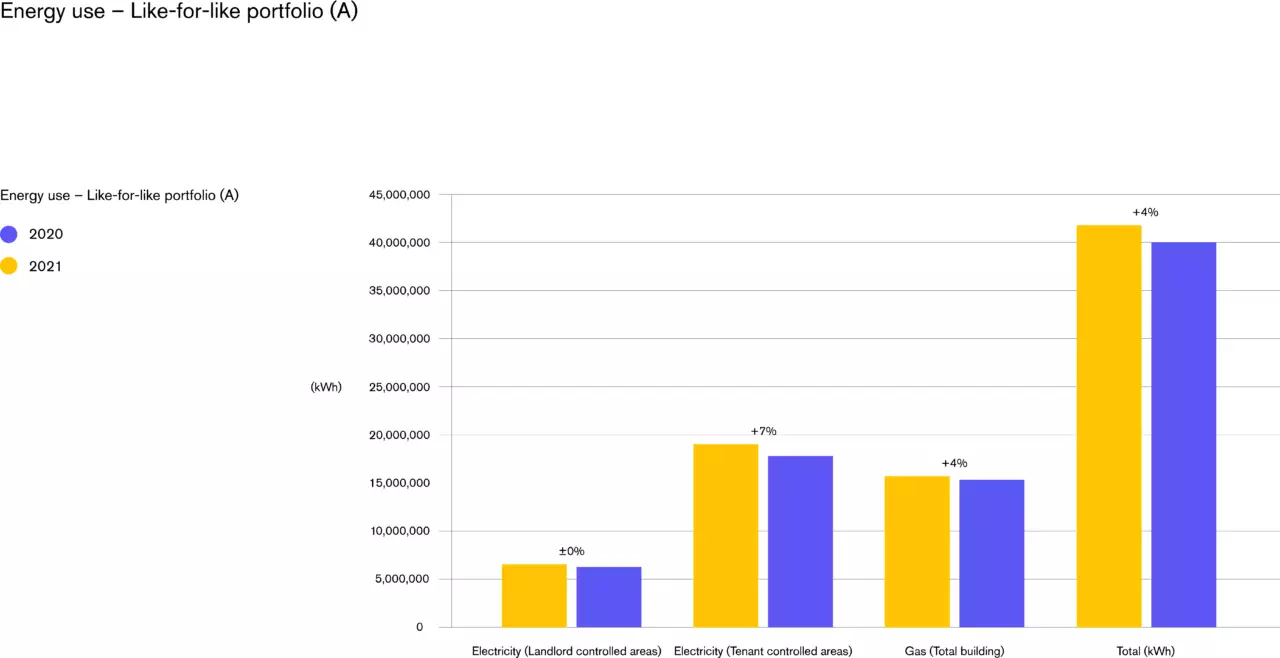
Energy use - like-for-like portfolio (A)
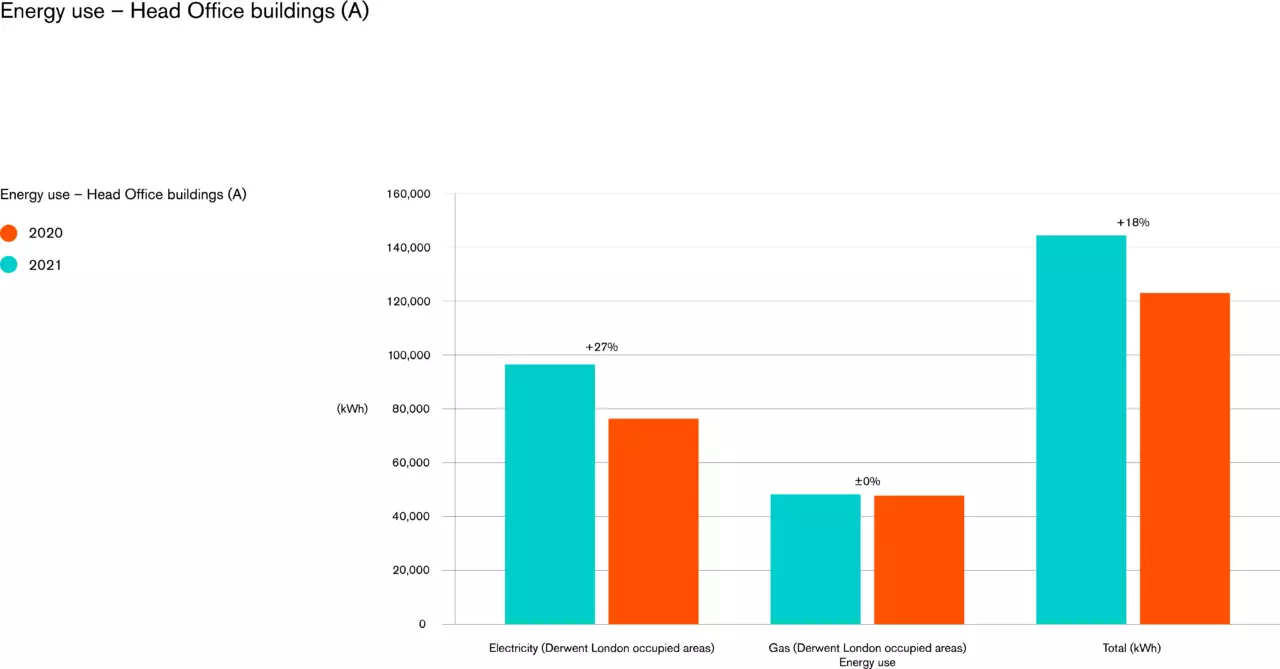
Energy use - head office buildings (A)
Total building energy performance (landlord and tenant) (kWh/m²)

SBT Energy intensity reductions
Additional details electricity and gas


Health & safety
Basis of reporting
We measure and report our health and safety data across three primary areas:
- Our managed portfolio – ensuring the safe, healthy and secure operation and maintenance of our buildings
- Employees – ensuring the safety, health and wellbeing of our employees
- Developments – ensuring our projects are designed and delivered safely and without risk to health
Reporting period
Our reporting period is aligned to our financial year, which is set to the calendar year – 1 January to 31 December 2021.
Reporting boundary
Our reporting boundary focuses on work-related incidents only and the scope is as follows:
Includes:
Managed portfolio*
- Derwent London employees working in our buildings
- 47 office properties and 31 residential units
- Accidents and incidents occurring in landlord areas
- For the injury rate, this only includes injuries related to our building managers.
Employees
- Derwent London employees based at our head office location
Developments
- All our development / managed portfolio projects including refurbishments, which are over one month in duration
- Accidents and incidents from smaller works less than one month in duration
- Data reported relates to 84 projects
Excludes:
Managed portfolio*
- Incidents occurring within single let properties where there is no management control, occupier spaces, retail spaces and incidents involving third party contractors working in our buildings
Employees
- Derwent London employees based in our buildings – these will be captured in our managed portfolio reporting
Developments
- Derwent London employees based in our buildings – these will be captured in our managed portfolio reporting
*The managed portfolio building count for our health and safety data differs from that of our environmental data because we maintain a health and safety responsibility for buildings or parts of buildings where we do not control or have influence over utility consumption.
We report our health and safety data across seven key performance indicators for our managed portfolio, employees and developments, these are:
- Person hours worked – For employees, this is calculated as Derwent London employees apart from building managers. For the managed portfolio this is just the building managers working in our properties. For construction, this is all person hours worked on construction sites in line with the above reporting boundary.
- Minor accidents – A work-related incident, which is not a RIDDOR, but resulted in harm to an individual e.g. a slip, trip or fall.
- RIDDORS – Any reportable incident under the RIDDOR regulations, including fatalities, seven-day lost time incidents and applicable dangerous occurrences.
- Lost time injury - Lost time injuries are defined as any injury which results in one to six days where the person is unable to perform their normal duties. Anything over seven days must be recorded as a seven-day injury under RIDDOR (eight days including the day of the accident).
- Dangerous occurrences (as defined by RIDDOR) – These include incidents involving, lifting equipment, pressure systems, overhead electric lines, electrical incidents causing explosion or fire, explosions, biological agents, radiation generators and radiography, breathing apparatus, diving operations, collapse of scaffolding, train collisions, wells and pipelines or pipeline works.
- Fatalities – Occupational activities resulting in death
- Prohibition / Improvement notices – A notice issued by either a Local Authority or the HSE should they find an immediately dangerous issue during a site inspection
We also report our health and safety data across four key rates, these are:
- Injury rate – (injuries excluding RIDDOR and lost time injuries) / (total hours worked) x 1,000,000. For the managed portfolio, this only includes injuries related to our building managers.
- Lost day rate – (lost time injuries excluding RIDDOR) / (total hours worked) x 1,000,000. This is not reported for employees or for the managed portfolio.
- Severity rate – total number of lost work days (excluding RIDDORs) / total number of incidents. This is not reported for employees or for the managed portfolio.
- RIDDOR accident frequency rate (AFR) - the number of RIDDORs / (total hours worked) x 1,000,000
Developments
Scope
The reporting scope for our developments covers our large development projects, refurbishments and small projects, which are notifiable to the Health and Safety Executive (HSE).
Methodology
Our principal contractors are required to collate all the requisite health and safety data and return it to our Health and Safety Team monthly. This information is then compiled into a report, reviewed and the data trended. This report is then sent through to the Health and Safety Committee and the Risk and Audit Committees on a bi-monthly and quarterly basis respectively.
Managed portfolio and employees
Scope
The reporting scope for our managed portfolio covers our managed properties, directly employed staff that work in our buildings and members of the public visiting or buildings. It covers incidents occurring in landlord areas only. The reporting scope for our employees covers directly employed staff at our head office location.
Methodology
We use a health and safety data management system – RiskWise. Each property is required to submit all incident data into RiskWise. The incident data is captured by this system with the building manager responsible for ensuring it is populated with data at the required intervals. This system automatically collates and trends the data and allows for the collation of statutory documentation. Our Health and Safety team review the output from RiskWise on a bi-monthly basis and then report this through to the Health and Safety Committee and the Risk and Audit Committees on a monthly and quarterly basis respectively.
Reporting frameworks
Energy performance certificates
The Minimum Energy Efficiency Standards (MEES) regulations came into force on 1 April 2018, impacting both residential and commercial properties in England and Wales.
We have set out below a breakdown of our Energy Performance Certificate (EPC) ratings together with the floor area and by the proportion of estimated rental value (ERV) they represent, so as to show the financial value/weighting of each rating band.
EPRA reporting
The property companies, investors and consultants that make up the European Public Real Estate Association (EPRA) aim to establish best practice in accounting, reporting and corporate governance.
In the table here, we provide a comprehensive breakdown of our full alignment with EPRA’s best practice recommendations on sustainability reporting. We have also listed our performance measures data in our 2021 annual report and accounts.
Download our EPRA report.
Like-for-like data points for the previous year have been restated in line with our like-for-like methodology. See link for our Base data methodology.
Overarching recommendations
5.1 Organisational boundaries
This is explained in the methodology section, see link here.
5.2 Coverage
See our methodology section here for a full breakdown of our various reporting scopes and subsequent coverage.
5.3 Estimation of landlord-obtained utility consumption
None of our data presented above is estimated, except where a property exited or came into the portfolio during the year, where we pro-rata the data to annualise the consumption as part of our intensity portfolio reporting to ensure fair representation.
5.4 Third Party Assurance
We undertake assurance on our resource efficiency data in accordance with ISAE3000 to a reasonable level. A public assurance statement from our auditors Deloitte LLP can be found here, see the link here.
5.5 Boundaries – reporting on landlord and occupier consumption
We report both landlord and occupier derived consumption for electricity and subsequently carbon. We report gas, water and waste on a whole building basis. This is clearly shown in the following sections of our data report:
Managed (absolute) and Like-for-like landlord and tenant carbon emissions
Managed (absolute) and Like-for-Like landlord and tenant energy consumption
Managed (absolute) and Like-for-Like waste generated and proportion by disposal route.
See our reporting boundary link here.
5.6 Normalisation
Intensity indicators based on floor area (m2) are provided for energy, water and carbon. Please refer to the respective data report sections for the relevant intensity indicator. We also add a financial intensity indicator of tCO₂e/£m turnover and tCO₂e/fair market value to our carbon reporting for additional performance context.
5.7 Analysis – Segmental analysis
(by property type, geography)
All our reporting portfolios (total managed, like-for-like and intensity) report on the one typology – commercial office space, which is all located in central London. As a result, it is not possible to compare location and typology (segmentation) within our portfolio to establish geo-spatial differences across varying property types. See the Scope section for confirmation of the basis of our reporting here.
5.8 Disclosure on own office
We disclose our energy use at our head office buildings here.
5.9 Narrative on performance
See our performance summary, visit this link in our R&A2021 pages 88–89. Likewise, we provide commentary on the shifts in our carbon footprint in our science-based target section, visit this link
5.10 Location of EPRA sustainability performance measures in companies’ reports
We provide a dedicated section in our 2021 Report & Accounts on sustainability, (see pages 271-273), which also includes a full summary of our carbon footprint and headline performance and data results. This annual responsibility report then provides a detailed review of our sustainability work, performance and resource efficiency data. Moreover, we have developed this section of the report to enable our stakeholders to easily access the best practice aspects set out in the EPRA recommendations document.
Other issues to consider
6.1 Materiality
The results of our materiality assessment/review are shown in the ‘Materiality’ section, visit this link.
6.2 Emerging indicator – return on carbon emissions (ROCE)
We report two sets of financially orientated carbon intensity measures – tCO₂e/£m turnover and tCO₂e/fair market value. Visit this link.
6.3 Socio-economic indicators related to sustainability performance
We have mandated a performance measure to undertake socio-economic assessments of our new developments 12 months after full occupation. Moreover, we are the only UK-based REIT that operates its own self-funded Community Fund – details are provided in the community section, and please visit our website via this link.
Also see our R&A2021 pages 52–63.
Likewise, we report on the community contributions, visit this link– this can be seen in our R&A2021 on page 52.
6.4 Transport
We have measured our employee commuting carbon and have found it to be de minimus i.e. <5% of our total footprint, therefore we have not included it in our Scope 3 carbon reporting.
However, we will continue to monitor it. We do not yet measure and report the emissions associated with employee occupiers travelling to and from our properties.
6.5 Refrigerant gases
We report fugitive emissions from our managed air conditioning and chilling equipment as part of our Scope 1 carbon figures. To see our emissions footprint, see tables 3, 4, 5 and 6, and visit this link for more detail.
UN SDG disclosures
The United Nations Sustainable Development Goals (SDG) are an international standard developed to support global change and sustainable growth. We believe that we have a role in supporting the UK in responding to this standard and helping affect change.
We have reviewed the suite of 17 goals and have selected those goals which align most closely to our ESG priorities, which are set out in the table below with a summary of our progress against the goals which are particularly significant to our business.
See link to our UN SDG disclosure table
RE100 & Renewable energy reporting
RE100 is a global corporate renewable energy initiative that brings together hundreds of large and ambitious businesses committed to 100% renewable electricity – matching 100% of the electricity used across their global operations with electricity produced from renewable sources. These can include biomass (including biogas), geothermal, solar, water, and/or wind – either sourced from the market or self-produced.
The Renewable Energy Guarantees of Origin (REGO) scheme provides transparency to consumers about the proportion of electricity that suppliers source from renewable generation. Derwent London is committed to being part of the RE100 and purchasing 100% of our electricity through REGO-backed contracts.
In 2021, 99.4% of the electricity we purchased for our properties was through REGO-backed tariffs. Administration difficulties led to the contracts for three properties not being renewed on REGO-backed contracts; this will be rectified at the next renewal. We have increased our procurement of green gas from 1% in 2020 to 23% in 2021.
For our on-site renewable generation, we generated 48,188 kWh of electricity from photovoltaic (PV) panels installed across our buildings. This represents 0.6% of our total electricity consumption.
TCFD disclosure
The Task Force on Climate-related Financial Disclosures (TCFD) was formed by the Financial Stability Board, an international body that seeks to strengthen and protect global financial markets from systemic risks such as climate change. The TCFD provides guidance on the disclosure of information on the financial implications of climate-related risks and opportunities, so that they can be integrated into business and investment decisions.
Set out in the link is our latest disclosure based on the recommendations of the TCFD. For complementary disclosures on climate-related aspects, go to our GRI Index reporting here.
GRI reporting
Global Reporting Initiative (GRI) provides standards to help organisations understand their outward impacts on the economy, environment, and society, including those on human rights. This increases accountability and enhances transparency on their contribution to sustainable development.
This report has been prepared in accordance with the GRI Standards Core option to allow our stakeholders to gauge the robustness of our reporting. Our index table below reflects the outcomes of our materiality assessment and links together the supporting evidence for each indicator, its location and whether it has been subject to external assurance.
Download our GRI reporting table here
Note on aspect boundaries:
Although all our material issues have both internal and external impacts, we have attempted to provide clarity and context to identify which entities and/or stakeholders these impacts might affect. To that end, we have provided a list of the key internal and external stakeholders and entities for each issue. These are by no means exhaustive. For our internal stakeholders we have indicated the teams or departments which have a direct responsibility to deal with or manage the impact of the issue(s). We believe this is appropriate given the relatively small size and geographically-focused nature of our business.
In terms of where these impacts occur, our business operations (including our subsidiaries) are entirely focused in the UK – more specifically central London (save for our third-party managed shopping centre in Strathkelvin, Scotland). We do, though, recognise that we have impacts beyond the UK through our supply chains: our construction supply chains, for example, source products and systems globally.
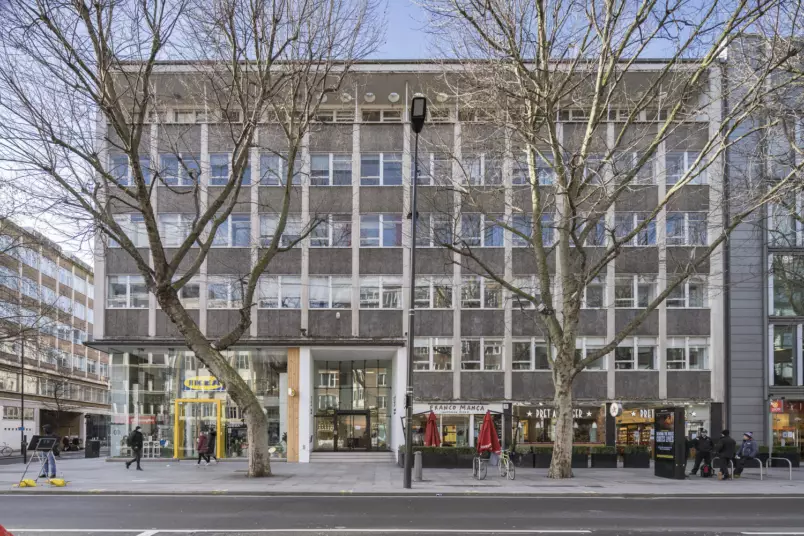
Energy benchmarking
Total building energy performance (landlord and tenant)
We use a range of tools and techniques to track the energy performance of our buildings.
For existing buildings, we install advanced building management systems to automate scheduling and condition-based energy savings measures, and the outcomes are measured against our annual portfolio-wide energy targets.
For the design of new developments, we have committed to mandating NABERS UK for all new developments and major refurbishments. For smaller projects, we use established energy modelling methods such as TM54 to predict the energy impact, in relation to the newly set building specific operational energy targets.
The total building energy performance analysis is one of the key tools we use to benchmark performance. This compares the energy intensities of each Derwent property over the past year against the previous 12-month period. The chart also ranks buildings from the highest intensity to the lowest.
Download our Energy benchmarking data
Energy performance benchmarking
Our Sustainability team has selected four buildings from our portfolio to show the breakdown of their performance and usage of different energy types.
* Estimated in-operation energy usage. As of 2021, we now require TM54 predicted operational energy assessments to be carried out for smaller retrofits and refurbishments.
6-8 Greencoat Place SW1
Predicted*: 104kWh/m2
2021: Under refurbishment
2019: 194kWh/m2
EPC
Current EPC - B
Previous EPC - E
- Heritage features have been retained throughout the building including vaulted ceilings, cast iron columns, basement vaults, and internal Victorian brickwork
- Installation of an all electric servicing strategy, high-efficiency air source heat pump and LED lighting
- Air handling plant with improved specific fan power was prioritised to reduce energy losses through the building ventilation system
- Replacement of existing glazing elements with high performance double-glazed units
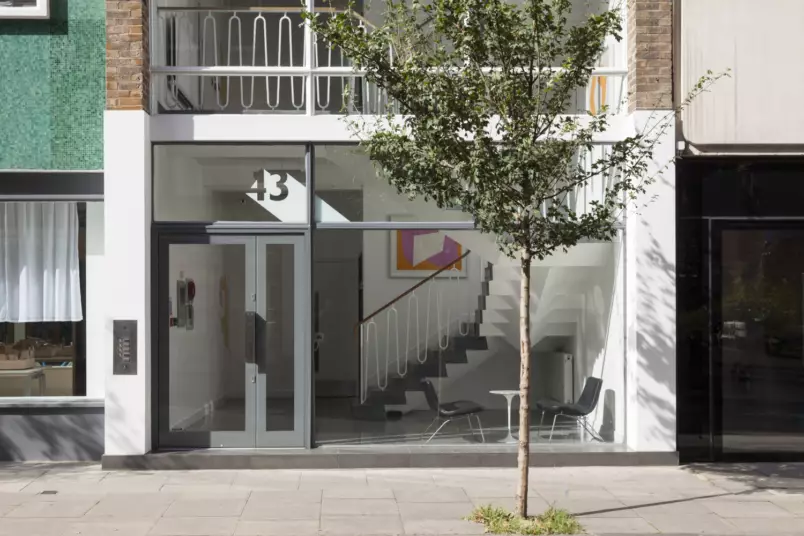
43 Whitfield Street W1
Predicted: 126kWh/m2 (based on TM54 assessment)
2021: Under refurbishment
2019: 132kWh/m2
EPC
Current EPC - B
Previous EPC - C
- Removal of gas boilers; installation of all electric air source heat pumps
- Replaced single glazed Crittall windows to double glazed
- LED lighting throughout
19-23 Fitzroy Street W1
Predicted: N/A
2021: 34kWh/m2
2019: 43kWh/m2
EPC
Current EPC - A - Refurbished floors
Previous EPC - C
- All electric VRF system specified and passive ventilation targeted.
- LED lighting throughout
95/100 Tottenham Court Road W1
Predicted: N/A
2021: 225kWh/m2
2019: 232kWh/m2
EPC
Current EPC - C
Previous EPC - D
- Gas-fired boilers replaced with electric heat pumps
- LED lighting throughout
Benchmark scores
GRESB (Global Real Estate Sustainability Benchmark) 2021 – score of 81, Greenstar status, 'A' rated public disclosure
CDP 2021 – 'C' rating
ISS Oekom – Prime status
MSCI – 'AA' rating
EPRA Sustainability Reporting Awards 2021 – Gold award
Green finance
Our Green Finance Framework (the Framework) is an important tool in our move towards becoming a net zero carbon business, as it demonstrates the clear link between our development and refurbishment financing and our net zero objectives. It sets out how we enter Green Financing Transactions (GFTs) to fund projects that will deliver environmental benefits alongside supporting our business strategy and purpose.
The Framework has been updated again this year as a result of the debut green bond issuance in November 2021. The Framework has been prepared in line with the principles set out in the LMA Green Loan Principles and ICMA Green Bond Principles guidance document and has been externally reviewed and a second party opinion has been obtained. The latest Framework is available on the website www.derwentlondon.com.
Our £350m Green Bond issuance, together with the existing £300m green tranche included within our main corporate £450m revolving credit facility, takes our total GFTs to £650m. This will used to fund qualifying green expenditure.
In line with the reporting requirements of the Framework, we set out below our annual disclosure of the qualifying green expenditure against our current eligible projects, their impact to date, and the independent assurance statement from our non-financial auditors, Deloitte LLP.
Reporting period
Our reporting period is aligned to our financial year, which is set to the calendar year – 1 January to 31 December 2021.
Reporting scope
We report and measure the progress of our Eligible Green Projects (EGPs) across eight areas:
- Project name - Identification of the scheme/asset(s)
- Description - A description of the scheme/asset(s)
- Expected completion date - Estimated scheme/asset(s) completion date
- Size - Scheme/asset(s) floor area
- Projected cost - Projected total project cost
- Category for eligibility - The criteria used to determine whether the scheme/asset(s) will qualify as an eligible green project as set out in section 3.1 – Use of Proceeds in the Green Finance Framework
- Impact reporting indicators - The reporting indicator(s) used to demonstrate the impact of the eligible green project
- Impact Performance reporting - Performance against the impact reporting indicators
Framework criteria for eligibility
Within the Framework is an extensive list of eligibility criteria set out in section 3.1. The criteria are used to clearly characterise the sustainability credentials of a project and ensure alignment with our overall strategic priorities and the UN Sustainable Development Goals. To be considered for election each project must meet at least one of the criteria.
The borrowings issued under the Framework must also align with the Loan Market Association (“LMA”) Green Loan Principles or International Capital Market Association (“ICMA”) Green Bond Principles.
Eligible Green Project selection & approval
Prior to approval of a project it is fully appraised to assess the financial returns together with a full risk assessment to assess the benefits and impacts on our stakeholders. In addition, new projects are assessed to see whether they are eligible for green finance and in turn which eligibility criteria within the Framework it aligns with. The capital expenditure budget is approved through three main committees each with its own increasing specified approval authority level, these are:
- Cost Committee
- Executive Committee
- The main Board
As part of the approval process each project then undergoes a final review by the Head of Sustainability and the Group Treasurer, via the completion of the Green Finance Eligibility form, to determine correct alignment with the Framework criteria and whether the project can be elected as an EGP.
Impact Performance reporting
To monitor the ongoing progress of each EGP, each new development or major refurbishment project is required to have a Project Sustainability Plan in place, which is a requirement of our Responsible Development Framework. For other projects, this forms part of the relevant building’s sustainability plan. Each plan contains a series of performance criteria which are thematically aligned to the eligibility criteria set out in section 3.1 of the Green Finance Framework. The performance of the plans is monitored by both the Development and Sustainability Teams with formal reporting through to the Sustainability Committee via the Committee reporting dashboard.
Where the impact reporting has yet to be fully achieved e.g. a scheme is yet to receive its final assessment methodology certificate, we will always continue to track the progress via regular monthly and quarterly reporting which is mandated of our development projects. This ensures we can provide a meaningful update on our progress and ensure we are tracking funding correctly.
Each of the four EGPs which have been funded from the GFTs have been elected against the ‘Green Buildings: criteria 1’ of the Framework. To date, all projects are on track to meet their targeted certification ratings.
Current Eligible Green Projects
The Green Projects benefiting from the GFTs are: 80 Charlotte Street W1 (excluding Asta House and Charlotte Apartments); Soho Place W1 (excluding Site B - theatre); The Featherstone Building EC1; and 19-35 Baker Street W1 (excluding retail and refurbished residential). See details at the end of this section.
Financial monitoring
Qualifying expenditure on each EGP is tracked and reviewed against the budget and reported internally on a quarterly basis.
External reporting and monitoring requirements to be met are set out in section 3.4 of the Framework.
Qualifying green expenditure and green funding
The qualifying expenditure as at 31 December 2021 for each project is set out in the table below. This includes an element of ‘look back’ capital expenditure on live projects which had already been incurred as at the original refinancing date in October 2019. Soho Place and The Featherstone Building both commenced on site in 2019 and are due to reach practical completion in H1 2022.
The 19-35 Baker Street scheme commenced on site in October 2021. Costs incurred on the eligible sections of this development prior to October 2021 have been included in the ‘look-back’ spend for this project as they occurred prior to the project being formally elected.
Cumulative spend on each EGP as at the reporting date
EGP |
Look back spend £m |
Subsequent spend |
Cumulative spend £m |
|
Q4 19 – FY 2020 £m |
2021 spend £m |
|||
80 Charlotte Street W1 |
185.6 |
33.8 |
17.8 |
237.2 |
Soho Place W1 |
66.3 |
74.9 |
62.7 |
203.9 |
The Featherstone Building EC1 |
29.1 |
30.0 |
30.3 |
89.4 |
19-35 Baker Street W1 |
26.5 |
- |
5.8 |
32.3 |
307.5 |
138.7 |
116.6 |
562.8 |
|
The cumulative qualifying expenditure on EGPs was £562.8m, with £116.6m of this being incurred in 2021 (excluding expenditure incurred on 19-35 Baker Street prior to October).
The net proceeds of the bonds were initially used to repay amounts drawn under the Group’s revolving credit facilities, including the £300m green tranche, thereby refinancing the EGPs in line with our Green Finance Framework.
The drawn borrowings from GFTs as at 31 December 2021 were £360m, which included £10m from the green tranche of the RCF and the £350m green bonds. Therefore, there was £290m of headroom within the £300m green tranche of the Group’s £450m revolving credit facility as at 31 December 2021, of which £203m is available green headroom.
This is illustrated in the graph - see link here.
A requirement under the Framework and the facility agreement is for there to be an excess of qualifying spend on EGPs over the amount of drawn borrowings from all GFTs which, as shown above, has been met.

80 Charlotte Street W1
This mixed-use scheme completed in June 2020 and comprises 322,000 sq ft of offices, 43,000 sq ft of residential (10,000 sq ft affordable housing), 12,000 sq ft of retail and a new public realm park.
The project is our first all electric scheme with all the central heating and cooling provided from air source heat pumps, significantly reducing carbon emissions.
Completion date: |
Completed H1 2020 |
Size: |
377,000 sq ft |
Categories for eligibility: |
Green building, criterion 1 (excludes Asta House and Charlotte Apartments) |
Impact reporting indicators: |
Building certification achieved (system & rating) |
Impact Performance reporting: |
Achieved: |
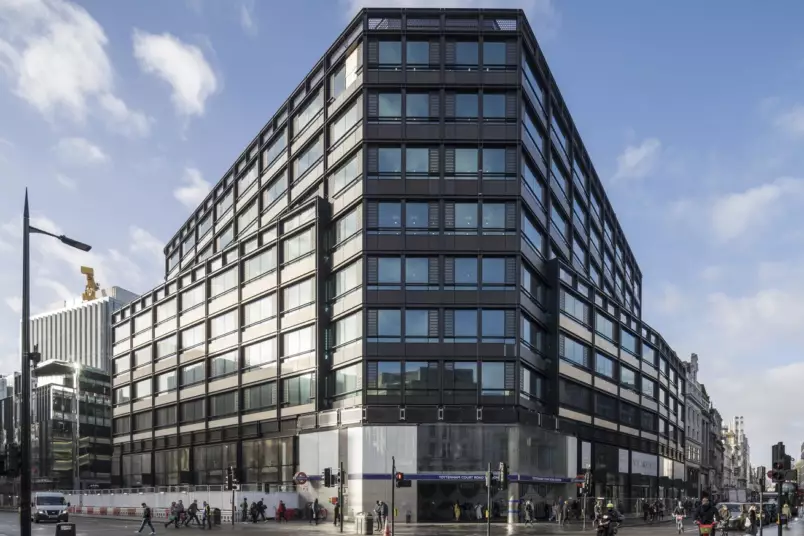
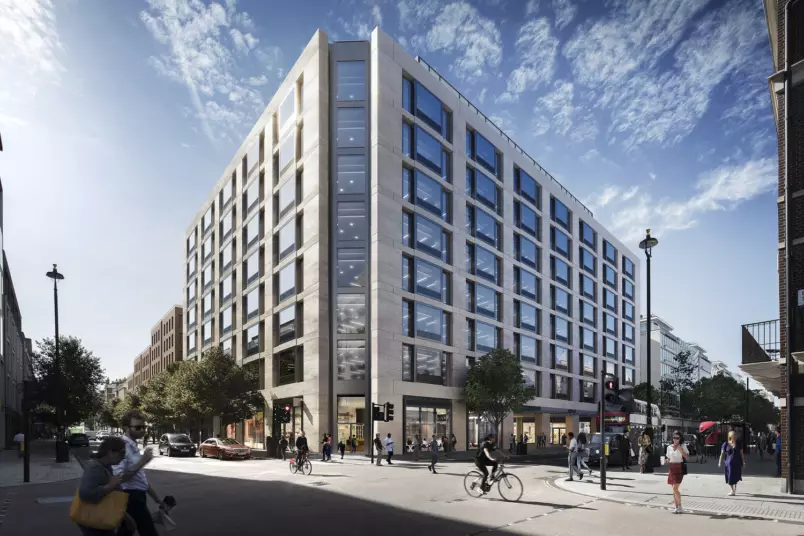
Soho Place W1
This is a 285,000 sq ft mixed-use scheme on the corner of Oxford Street and Charing Cross Road, directly above Tottenham Court Road station. It will comprise 209,000 sq ft of offices, 36,000 sq ft of retail, a 40,000 sq ft theatre and new public realm.
The project will have 115m2 of photovoltaics (solar panels) installed which will generate approximately 18 MWh of electricity per annum. 40% of the total roof area will be covered with brown roof which will be designed to attract a wide variety of biodiversity.
Expected completion date: |
2022 |
Size: |
285,000 sq ft |
Projected cost: |
£407m |
Categories for eligibility: |
Green building, criterion 1 (excludes Site B - Theatre) |
Impact reporting indicators: |
Building certification achieved (system & rating) |
Impact Performance reporting: |
Site A Achieved: Expected: Site B – Offices (excluding the theatre) Achieved: Expected: EPC – B, on target |

The Featherstone Building EC1
Planning permission was obtained in February 2016 for a 125,000 sq ft office development - an 81% floor area uplift. Demolition of the existing two buildings finished in September 2019 and the construction has commenced, with the scheme due for completion in 2022.
The project will utilise concrete core cooling which is a highly efficient cooling solution integrated into the ceiling slabs which removes the need for traditional air conditioning. It will also be powered using combined heat and power (CHP).
Expected completion date: |
2022 |
Size: |
125,000 sq ft |
Projected cost: |
£147m |
Categories for eligibility: |
Green building, criterion 1 |
Impact reporting indicators: |
Building certification achieved (system & rating) |
Impact Performance reporting: |
Achieved: Expected: |
19-35 Baker Street W1
Our next major scheme 19-35 Baker Street, which totals 298,000 sq ft, commenced in Q4 2021 when we exercised our development option with The Portman Estate. The development comprises 218,000 sq ft of offices, 52,000 sq ft of residential and 28,000 sq ft of retail.
The project will have a low carbon all electric central heating and cooling system derived from air source heat pumps. As well as joining our ‘long-life, loose-fit’ high quality portfolio, the building will be our first NABERS UK certified scheme.
The 19-35 Baker Street project includes part new development and part refurbishment. The project will be assessed under the BREEAM, LEED and Home Quality Mark standards where applicable. Sections of this project do not qualify for eligible expenditure under the Framework, relating mainly to the retail and refurbished residential elements, and these have been excluded from the qualifying green expenditure.
Expected completion date: |
H1 2025 |
Size: |
298,000 sq ft |
Projected cost: |
£463m |
Categories for eligibility: |
Green building, criterion 1 (excludes retail and refurbished residential) |
Impact reporting indicators: |
Building certification achieved (system & rating) |
Impact Performance reporting: |
Offices Expected: Private residential Expected: |
Green finance assurance statement
Independent assurance statement by Deloitte LLP to Derwent London plc on the application of the Green Finance Framework (‘the Framework’) in the financing of eligible green projects and in calculating qualifying green finance expenditure and selected environmental impact performance indicators included within the Responsibility Report and the Annual Report and Accounts, respectively, (‘the Reports’), for the year ended 31 December 2021 in accordance with the Loan Market Association’s (LMA) Extended Green Loan Principles (GLPs), 2021 and the International Capital Market Association’s (ICMA) Green Bond Principles (GBPs), 2021.

What we looked at: scope of our work
Derwent London plc engaged us to perform reasonable assurance procedures for the year ended 31 December 2021 on the following subject matters:
The application of the Framework (November 2021) in accordance with the LMA’s Extended GLPs (2021) and the ICMA’s GBPs (2021) in the financing of Derwent’s eligible green projects (defined as 80 Charlotte St (excluding Asta House and Charlotte Apartments), Soho Place Site A and Site B (excluding Site B Soho Place theatre), 19-35 Baker Street (excludes retail and refurbished residential) and the Featherstone Building) and in calculating qualifying green finance expenditure and reporting on selected environmental impact performance indicators within the Reports:
- Eligible green project listing (80 Charlotte St, Soho Place, 19-35 Baker Street and the Featherstone Building);
- Green funds allocated in aggregate to the eligible green projects (£360m as at 31 December 2021); and
- Remaining balance of unallocated funds within the green element of the RCF (£202.8m as at 31 December 2021).
Using the evaluation criteria - the Company’s Green Finance Framework (November 2021).
Environmental performance indicators:
Building certification achieved (system & rating) on eligible green projects (80 Charlotte St, Soho Place, 19-35 Baker Street and the Featherstone Building):
- 80 Charlotte St achieved BREEAM Excellent at design stage, BREEAM Excellent at post- construction stage and EPC final rating of B;
- Soho Place Site A achieved BREEAM Outstanding at design stage;
- Soho Place Site B achieved BREEAM Excellent at design stage;
- 19-35 Baker Street Offices achieved BREEAM Outstanding at design stage; and
- The Featherstone Building achieved BREEAM Outstanding at design stage.
Building certification expected (system & rating) per eligible green project:
- 80 Charlotte St expected LEED Gold;
- Soho Place Site A expected BREEAM Outstanding at post-construction stage, LEED Gold and EPC rating of B;
- Soho Place Site B expected BREEAM Excellent at post-construction stage and EPC rating of B;
- 19-35 Baker Street Offices expected BREEAM Excellent at post-construction stage, LEED Gold and EPC rating of A;
- 19-35 Baker Street Private residential expected Home Quality Mark rating of 4 Stars at design stage; and
- The Featherstone Building expected BREEAM Outstanding at post-construction stage, LEED Platinum and EPC rating A.
Using the evaluation criteria – the Company’s Green Finance Basis of Reporting.
Use of Report
This report is made solely to the Directors of Derwent London plc in accordance with our agreed terms of engagement. Our work has been undertaken so that we might state to the Directors of Derwent London plc those matters we have agreed to state to them in this report and for no other purpose.
Without assuming or accepting any responsibility or liability in respect of this report to any party other than Derwent London plc and the Directors of Derwent London plc, we acknowledge that the Directors
of Derwent London plc may choose to make this report publicly available for others wishing to have access to it, which does not and will not affect or extend for any purpose or on any basis our responsibilities. To the fullest extent permitted by law, we do not accept or assume responsibility to anyone other than Derwent London plc and the Directors of Derwent London plc as a body, for our work, for this report, or for the conclusions we have formed.
What we found: our unqualified assurance opinion
Based on the scope of our work and the assurance procedures we have performed, we conclude that the selected qualifying green finance expenditure and environmental impact performance data for the Company’s eligible green projects, are in all material respects, fairly stated in accordance with the applicable criteria, and that in all material respects the Framework (November 2021) has been applied in the financing of eligible green projects in accordance with the LMA’s Extended GLPs (2021) and the ICMA’s GBPs (2021).
What standards we used: basis of our work and level of assurance
We carried out procedures to obtain reasonable assurance1 on selected non-financial metrics and selected indicators specified above in accordance with the International Standard on Assurance Engagements 3000 (Revised) (“ISAE 3000 (Revised)”). To obtain reasonable assurance, ISAE 3000 (Revised) requires that we obtain an understanding of the underlying subject matter and engagement circumstances; identify and assess the risks of material misstatement in the subject matter information; design and perform procedures to respond to the assessed risks; and obtain sufficient evidence to support our assurance conclusion. Our materiality threshold was set at 5% for Green Capex misstatements and 3% for Headroom Control. This was considered to be the level at which a misstatement would be material to the users of the report and is consistent with similar non-financial assurance engagements.
The evaluation criterion used for our assurance are the Company’s definitions as described by Derwent London plc in its:
- Green Finance Framework (November 2021) available at: https://www.derwentlondon.com/... Framework-November-2021.pdf
- Green Finance Basis of Reporting for environmental performance impact indicators reported within the Green Finance section of the 2021 Responsibility Report and disclosed within the Finance Review section of the 2021 Annual Report and Accounts.
What we did: our key assurance procedures
Our work was planned to mirror Derwent London’s own project approval, green financing, and compilation processes, tracing how data for each indicator within our assurance scope was collected, collated and validated by corporate head office and included in the Reports.
To form our conclusions, our procedures comprised:
- holding interviews with management including the Sustainability team, Treasury and Finance function and those with operational responsibility for project evaluation and selection, management of proceeds, and reporting;
- reviewing and evaluating the criteria for assessing green project eligibility and management of proceeds as set out in the Framework, in accordance with the LMA’s Extended GLPs (2021) and the ICMA’s GBPs (2021) and in comparison, to the green finance and EGP green credentials disclosed within the Green Finance Basis of Reporting;
- virtually verifying the existence of Derwent London’s eligible green projects financed under the Framework;
- reviewing and evaluating the measurement and reporting criteria for the qualifying green expenditure of Derwent London’s allocation of drawn funds from the green finance proceeds under the Framework and comparing this to qualifying expenditure disclosures within the Green Finance Basis of Reporting;
- reviewing and evaluating the criteria for the measurement and reporting of each eligible green project impact performance indicator as set out in the Green Finance Basis of Reporting by inspecting: external green accreditations achieved; and third party contractor reports for anticipated project outcomes, against green accreditation requirements to support Derwent London’s best estimate of the status of targeted credentials, where relevant;
- inspecting Board minutes to confirm that for each EGP its project development plan and eligibility as a green project had been considered and approved and inspecting the latest Executive Committee meeting minutes to evidence ongoing monitoring of EGP capex, actual and expected costs and available headroom on the green finance facility on a quarterly basis;
- inspecting a sample of eligible green project sustainability plans and quarterly contractor reports to confirm that the use of proceeds of eligible green projects were consistent with the categories in the ‘Use of proceeds’ section 3.1 of the Framework;
- inspecting the internal monitoring of the EGP criteria, the capital expenditure to date, the drawn funds from the Green Bond and the headroom on the Green Finance Facility;
- inspecting the status of EGP indicators within the Sustainability Dashboards reported to the Sustainability Committee and Responsibility Committee;
- inspecting records maintained in Derwent London’s financial reporting systems and property management system to confirm the existence and ownership of eligible green projects, and to confirm that qualifying green expenditure was recorded in the green finance listing, including reviewing the green expenditure capex reconciliation to the audited group financials and management report;
- performing substantive testing on a sample basis on EGP qualifying green finance expenditure to validate it had been allocated in line with the Framework and had been appropriately measured, recorded and reported, including inspecting capex invoices, payment instructions, bank statements and records maintained in Derwent London’s financial reporting systems;
- performing testing procedures on the drawdown of green finance proceeds to validate if: funding had been used for qualifying green finance expenditure on the EGPs in line with the Framework, if drawdowns had been appropriately recorded, reported and had been made in line with the terms of the Agreement and if there was an excess of qualifying green expenditure on EGPs owned by Derwent London, over the amount of drawn borrowings from green finance proceeds as per the Framework. This procedure included inspecting drawdown and re-drawdown instructions, bank statements and records maintained in Derwent London’s financial reporting systems;
- reviewing and evaluating the quarterly headroom calculation, reconciliation and sign-off process (prior to internal Executive Committee reporting) to verify that there was an excess of qualifying green expenditure on EGPs owned by Derwent London, over the amount of drawn borrowings from all green finance transactions, including any green revolving credit facilities and Green Bond proceeds; and
- reviewing the content of the Green Finance Basis of Reporting, the Annual Report and Accounts and the Responsibility Report against the findings of our work making recommendations for improvement where necessary.
1 Our engagement provides reasonable assurance as defined in ISAE 3000 (Revised). Reasonable assurance means a high but not absolute level of assurance.
Inherent limitations
The process an organisation adopts to define, gather and report data on its non-financial performance is not subject to the formal processes adopted for financial reporting. Therefore, data of this nature can be subject to variations in definitions, collection and reporting methodology with no consistent, accepted standard. This may result in non-comparable information between organisations and from year to year within an organisation as methodologies develop. To support clarity in this process, Derwent London publishes the methodologies used to appraise green projects, manage qualifying green expenditure, and prepare the reported information (“the Framework (November 2021)” and “the Green Finance Basis of Reporting criteria”, respectively). We have carried out our assurance against these criterion and it should be read together with this assurance statement.
Our work did not include undertaking controls testing of the third party controls or systems involved in Derwent London’s green project impact data collection processes. Our assessment of management’s expectation of building accreditations anticipated but not yet received has been limited to comparing design accreditations received to those expected on completion, and enquiry of management to confirm basis for their assessment of project as “on track” or “not on track”.
Responsibilities of directors and independent assurance provider
Derwent London plc’s responsibilities
The Directors are responsible for the preparation of the Framework (November 2021), the Reports for the year ended 31 December 2021 and for the information and statements contained within. The Directors are responsible for determining the Company’s sustainability objectives and for establishing and maintaining appropriate performance management and internal control procedures, systems and controls to enable the Company to report accurate and complete information from which the application of the Framework (November 2021) and the contents of the Reports are derived. The Directors are responsible for meeting the Company’s contractual obligations with its lenders and for establishing and maintaining appropriate internal control procedures, systems and controls required to fulfil these obligations.
Independence and quality control
In conducting our engagement, we have complied with the Code of Ethics for Professional Accountants issued by the International Ethics Standards Board for Accountants, which is founded on fundamental principles of integrity, objectivity, professional competence, and due care, confidentiality and professional behaviour. The firm applies International Standard on Quality Control 1 and, accordingly, maintain a comprehensive system of quality control including documented policies and procedures regarding compliance with ethical requirements, professional standards and applicable legal and regulatory requirements.
Our responsibility is to express an independent assurance opinion on the metrics defined within the scope of work above to the Company in accordance with our letter of engagement. We conducted our engagement in accordance with International Standard on Assurance Engagements ISAE 3000 (Revised): Assurance Engagements Other than Audits or Reviews of Historical Financial Information, issued by the International Auditing and Assurance Standards Board (IAASB), in order to state whether the metrics reported have been prepared, in all material respects, in accordance with the applicable criteria. Our work has been undertaken so that we might state to the Company those matters we are required to state to them in this statement and for no other purpose. To the fullest extent permitted by law, we do not accept or assume responsibility to anyone other than Derwent London plc for our work, for this statement, or for the conclusions we have formed.
Deloitte LLP
London, United Kingdom, 23 February 2022
Performance targets
2021: Performance against our targets
Our annual sustainability targets across the four areas of development, property management, community and our employees.
2022: What's next?
Our targets for 2022
Despite the lingering backdrop of the pandemic, we are well-placed to maintain our high levels of service as well as deliver our regeneration projects, ensure the health and wellbeing of our employees and stakeholders and support our communities. We are fully committed to mitigating the impacts on our business of climate change, and to promoting the wider ESG agenda in a responsible and transparent way.
As the table below shows, our targets for 2022 align with our strategy and material issues but also reflect the ongoing impacts of the pandemic on our day-to-day activities.
Glossary
Automatic Meter Reading (AMR)
AMR is the technology of automatically collecting consumption, diagnostic and status data from water or energy metering devices and transferring that data to a central database for billing, troubleshooting, or analysis purposes.
Building Research Establishment Environmental Assessment Method (BREEAM)
BREEAM is an environmental impact assessment method for non-domestic buildings. Performance is measured across a series of ratings – Pass, Good, Very Good, Excellent and Outstanding.
Carbon dioxide equivalent (CO2e)
CO2e is a standard unit for measuring carbon footprints. It expresses the impact of each different greenhouse gas in terms of the amount of CO2 that would create the same amount of warming impact of each gas. As a result, the total impact of all these gases can be expressed as a single number in a same unit.
CDP
The CDP is an organisation which works with shareholders and listed companies to facilitate the disclosure and reporting of climate change data and information.
CIBSE TM54
CIBSE Technical Memorandum 54 (TM54) provides building designers and owners with clear guidance on how to evaluate operational energy use fully, and accurately, at the design stage. It sets out how the operational energy required for the building can be estimated - covering both regulated and unregulated loads.
Energy Performance Certificate (EPC)
An EPC is an asset rating detailing how energy efficient a building is, rated by carbon dioxide emission on a scale of ‘A’-‘G’, where an ‘A’ rating is the most energy efficient. They are legally required for any building that is to be put on the market for sale or rent.
European Public Real Estate Association (EPRA)
EPRA is an association of Europe’s leading property companies, investors and consultants which strives to establish best practices in accounting, reporting and corporate governance.
FTSE4Good
The FTSE4Good is an index that has been developed to measure objectively the performance of companies that meet globally recognised corporate responsibility standards, such that organisations can make effective decisions when assessing or creating responsible investment products.
Fugitive emissions
Fugitive emissions are emissions of gases or vapours from pressurised equipment such as air conditioning units due to leaks and other unintended releases/losses.
Global Real Estate Sustainability Benchmark (GRESB)
The Global Real Estate Sustainability Benchmark is an initiative set up to assess the environmental and social performance of public and private real estate investments and allow investors to understand their performance.
Global Reporting Initiative (GRI)
The Global Reporting Initiative is an internationally recognised sustainability reporting framework which provides metrics and methods for measuring and reporting sustainability related impacts and performance.
Greenhouse Gas (GHG) Protocol Corporate Accounting standard
This internationally recognised standard sets out methodologies for businesses to collate, calculate and report all the GHG emissions they produce.
Home Quality Mark (HQM)
HQM is an assessment standard for new homes. Performance is measured across a series of star ratings 1-5.
Institution of Occupational Safety and Health (IOSH)
The Institution of Occupational Safety and Health (IOSH) is the chartered body and largest membership organisation for safety and health professionals. It acts as a champion, adviser, advocate and trainer for health and safety professionals working in organisations in around 130 countries.
ISS-Oekom
ISS-Oekom is an ESG rating service that provides corporate and country ESG research and ratings that enables its clients to identify material social and environmental risks and opportunities.
Leadership in Energy and Environmental Design (LEED)
LEED is a US based environmental impact assessment method for buildings. Performance is measured across a series of ratings – Certified, Silver, Gold and Platinum.
Loan Market Association (LMA) Green Loan Principles
The green loan principles aim is to create a high-level framework of market standards and guidelines, providing a consistent methodology for use across the green loan market. It comprises a series of voluntary recommended guidelines that seek to promote integrity by clarifying the instances in which a loan may be categorised as “green”.
Minimum Energy Efficiency Standard (MEES)
MEES sets a minimum energy efficiency level for buildings. By 2023, all commercial leases must be rated with EPC ‘E’.
National Australian Built Environment Rating System (NABERS)
This is a building performance rating system which provides an energy performance benchmark using a simple star rating system on a 1-6 scale. This helps property owners understand and communicate a building’s performance versus other similar buildings to occupiers. Ratings are validated on an annual basis. It has been adopted in the UK as NABERS UK and is administered by the Building Research Establishment (BRE); NABERS UK currently relates to offices only.
National Examination Board in Occupational Safety and Health (NEBOSH)
The National Examination Board in Occupational Safety and Health (NEBOSH) is a leading global organisation, which provides health, safety and environmental qualifications to help to raise the competence of safety and environmental professionals, as well as individuals at all levels in the workplace.
Radiative forcing
Radiative forcing is the change in the energy balance in the lower atmosphere by a climate change mechanism. In this case, the change mechanism we reference in this report is aircraft emissions. Aircraft emissions contribute to this energy change in a number of ways e.g. they release substances that trigger the generation of aerosol particles or lead to changes in natural clouds such as contrails.
Renewable Energy Guarantees of Origin (REGO)
The REGO scheme administered by Ofgem provides transparency to consumers about the proportion of electricity that supplier’s source/provide from renewable generation.
Reporting of Injuries, Disease & Dangerous Occurrences Regulations, 2013 (RIDDOR)
RIDDOR requires employers and those in control of premises by law to report specified workplace incidents, such as work-related fatalities, major injuries, seven-day injuries (those causing more than seven days inability to carry out normal duties), work related diseases, and dangerous occurrences (near miss accidents).
Science Based Target initiative (SBTi)
The Science Based Targets initiative (SBTi) is a collaboration between CDP, the United Nations Global Compact, World Resources Institute (WRI) and the World Wide Fund for Nature (WWF). The SBTi defines and promotes best practice in science-based target setting and independently assesses and approves companies’ targets. Science-based targets provide companies with a clearly defined pathway to future-proof growth by specifying how much and how quickly they need to reduce their greenhouse gas emissions.
Scope 1 carbon (AKA direct emissions): includes a company’s emissions from items such as gas use in boilers, corporate fuel consumption in company cars and emissions from refrigerants used in air conditioning equipment.
Scope 2 carbon (AKA indirect emissions): includes emissions from landlord electricity consumption but excludes occupier electricity usage.
Scope 3 carbon (AKA other indirect emissions): includes items such as emissions from occupier electricity consumption, embodied carbon, business air travel, water and waste.
Streamlined energy and carbon reporting (SECR)
The SECR regulations were introduced in April 2019 and require companies incorporated in the UK to undertake enhanced disclosures of their energy and carbon emissions in their financial reporting. Companies are required to comply with SECR if they have two of the three qualifying conditions; at least 250 employees, an annual turnover greater than £36m and an annual balance sheet total over £18m.
Task Force on Climate-related Financial Disclosures (TCFD)
Set up by the Financial Stability Board (FSB) in response to the G20 Finance Ministers and Central Bank Governors request for greater levels of decision-useful, climate-related information; the TCFD was asked to develop climate-related disclosures that could promote more informed investment, credit (or lending), and insurance underwriting decisions. In turn, this would enable stakeholders to understand better the concentrations of carbon-related assets in the financial sector and the financial system’s exposures to climate-related risks.